Previously, regions of interest were isolated from their background. This is done to do more analysis and processing. Thresholding were done previously but this time, color will be used to segment images since thresholding won't be useful when grayscale value of the region of interest is the same as that of the background.
This activity will implement parametric and non-parametric probability distribution to segment images based on color.
For every pixel, there is a corresponding red, green, and blue values. The normalized chromaticity coordinates is given by

where I = R + G + B and r+g+b=1. Since b=1-r-g, the chromaticity can be explained by r and g. Figure 1 shows the normalized chromaticity space.
 |
| Figure 1. The normalized chromaticity space |
An image of an object with a blue color was obtained as shown in Figure 2. The blue box will then be segmented using the parametric and non-parametric probability distribution. A monochromatic region was cropped from the region of interest. It is also shown in Figure 2.
 |
| Figure 2. Image to be used for segmentation (left) ; patch from the image (right) |
The color of the patch was represented as points in the NCC space. Since the object is mainly blue, the coordinates must lie in the blue region in the NCC space.
After cropping a monochromatic part of the region of interest, the histogram of it was calculated. An algorithm was done in Scilab to derive the Gaussian Probability Distribution Function. The mean (μr
and μg) and standard deviation (σr
and σg) were first calculated. Then the probability can be obtained separately by

This is then the probability that a certain pixel belongs to the region of interest. The joint probability is obtained by multiplying the probability that a pixel with chromaticity r to the probabilty that a pixel with chromaticity g belong to the ROI.
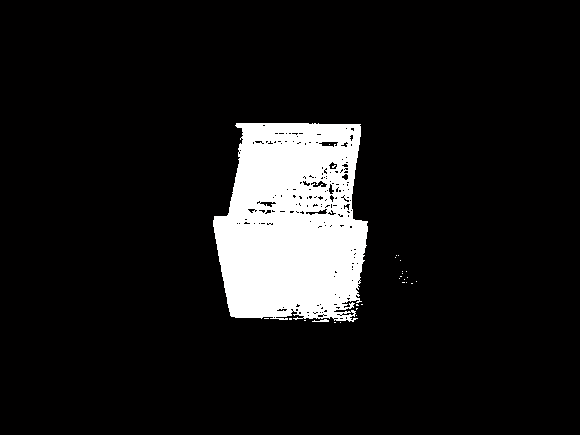
Figure 3 shows the resulting image after applying the Gaussian Probability Distribution Function. It can be seen that the
 |
| Figure 3. Output from parametric segmentation |
For the non-parametric probability distribution estimation, the location of the rg chromaticity was first taken and it is shown in Figure 4. The 2D histogram of the region of interest was obtained using the code provided in the manual:

 |
| Figure 4. 2D histogram |
Figure 5 shows the resulting segmented image after histogram backprojection. The 2D histogram that was obtained previously was used to backproject the image to be segmented.
 |
| Figure 5. Output from non-parametric segmentation |
It can be observed from the two methods were able to isolate the region of interest from its background. However, in the parametric segmentation the shading variations were more captured compared with the output from the non-parametric probability distribution estimation. The advantage of the non-parametric probability distribution estimation is that the use of histogram backprojection makes it a much easier method.
Reference
[1] Soriano, M. A11 - Image Color Segmentation. 2010
Self-evaluation:
I would give myself a 10 for producing all the necessary output. I was also able to learn and understand the ideas behind the activity.
No comments:
Post a Comment